
Training load
Know when to push and when to rest
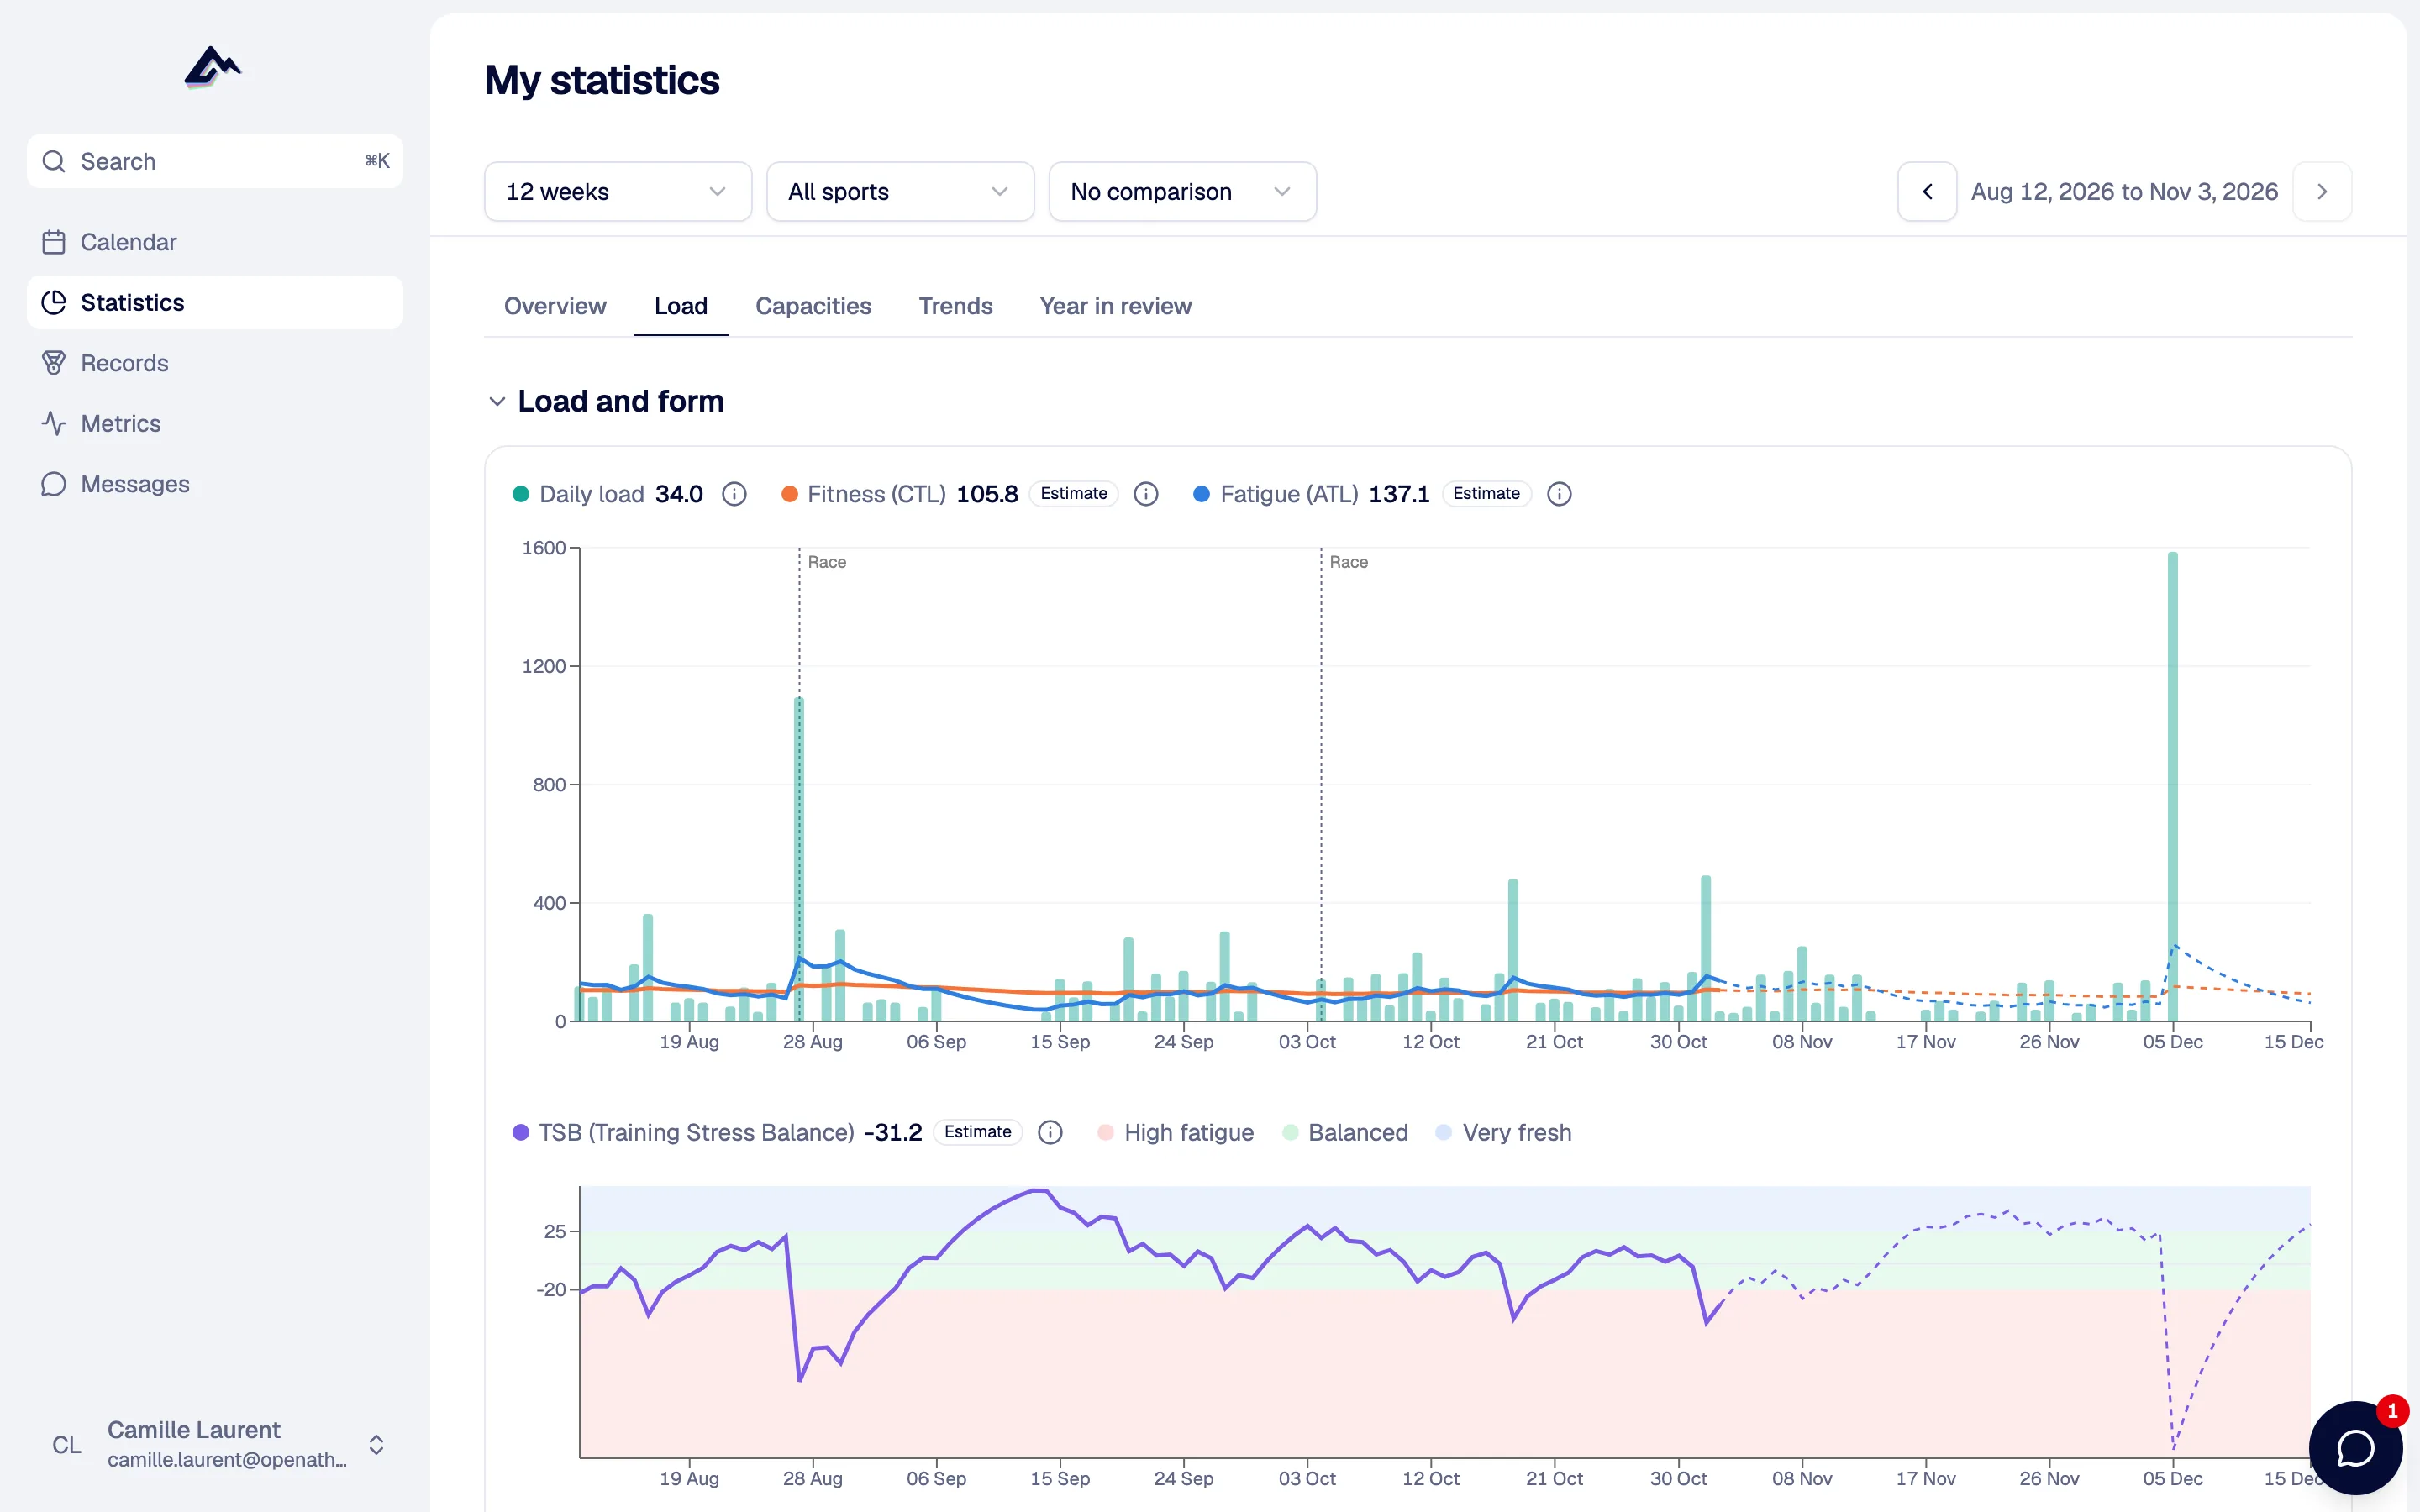
Every session with a heart rate becomes a load. From those loads come three curves: fitness, fatigue and form. They run into the weeks you have planned, so you see race-day form before race day.
- No power meter needed
- Formulas on GitHub
- Projected over your plan
The three curves
What CTL, ATL and TSB mean
The Banister model, the same idea behind most training-load charts. Two averages of your daily load, one slow and one fast, and the gap between them.
Fitness
CTL · 42 days
What months of training have built. It moves slowly: a great week barely nudges it, a month off pulls it down.
CTL += (1 − e^(−1/42)) × (load − CTL)
Fatigue
ATL · 7 days
What the last week costs you. It rises fast after hard days and falls fast when you rest.
ATL += (1 − e^(−1/7)) × (load − ATL)
Form
TSB = CTL − ATL
Fitness minus fatigue. Negative while you are loading, back above zero when you ease off before a race.
TSB = CTL − ATL
Load per session
TRIMP: load from heart rate
Banister's training impulse multiplies time by how far into your heart rate reserve you were, and weights the hard minutes exponentially. One hour easy and twenty minutes hard can cost the same. The app integrates your heart rate second by second; with only an average it uses that.
TRIMP = min × HRr × y × e^(k × HRr)
HRr = (HR − HRrest) / (HRmax − HRrest)
Coefficients: 0.64 and 1.92 for men, 0.86 and 1.67 for women.
It needs your maximum and resting heart rate in your metrics. Without a heart rate, an activity adds no TRIMP.
TRIMP in the glossary: formula and worked exampleHRr = (150 − 50) / (190 − 50) = 0.714
60 × 0.714 × 0.64 × e^(1.92 × 0.714)
TRIMP108
Session RPE, side by side
Give an activity an effort score from 0 to 10 and the app also computes Foster's session RPE: RPE × minutes. 50 minutes at RPE 6 makes 300. Useful to compare how hard it felt with what your heart said. The fitness curve itself stays on TRIMP, so the two scales never mix.
Session RPE in the glossaryPlanned sessions
See race-day form before race day
Planned sessions get an estimated load in the same TRIMP unit, so done and planned add up. Fitness, fatigue and form then continue over the plan, day by day on the calendar and week by week on the season view. Move a long run and the curve moves with it.
How a planned session gets its load
- 1Heart rate targets: summed step by step, because the formula is not linear.
- 2Pace or power targets: an AI estimate calibrated on your past sessions, if AI is set up.
- 3Otherwise: planned duration and target RPE, converted to the heart rate that effort usually brings. No AI key needed.
Each week also shows its load against a recommended range built from your recent weeks. It is a rule of thumb to frame a week, not a safety limit.
Training calendarReading the chart
Reading your form before a race
During a training block, form usually sits below zero: you are carrying fatigue on purpose. In the taper, fatigue drops faster than fitness and form climbs back above zero. Most people aim to arrive at a race slightly positive, not as high as possible: too long a taper costs fitness.
The two marks, −20 and +25, are the ones in OpenAthlete's code. They are conventions to describe the curve, not validated limits: −25 is not a diagnosis of overreaching, and a taper reaches +25 too.
Different numbers
Why our numbers differ from your watch
Garmin, COROS, Suunto and Polar each compute their own training load with their own models, mostly closed. TrainingPeaks uses TSS, where one hour at threshold is 100. OpenAthlete uses Banister TRIMP from heart rate. The scales are different, so a TRIMP of 108 is not "more" than a TSS of 80. Compare the trend of one system with itself.
Open formulas
Formulas you can audit on GitHub
No black box. The constants, their sources and the code that turns a heart rate stream into fitness are public, under AGPL-3.0. Found a mistake? Open an issue. In the app, every derived metric has a short "what it is" and "limits" note.
Questions people ask
No. Load comes from heart rate, from a chest strap or the watch's wrist sensor. You need your maximum and resting heart rate in your metrics.
It adds no TRIMP, so it does not move the fitness curve. If you give it an RPE, its session RPE (RPE × minutes) is still computed and shown.
Different unit. TRIMP and TSS are different scales, and watch brands use their own models. Look at the shape of the curve over weeks, not at the number.
No. Sessions with heart rate targets, or with a duration and a target RPE, are estimated by formula. AI only helps for sessions written in pace or power.
Yes. The coach dashboard shows fitness, fatigue and form for each athlete next to compliance and volume.
The rest of the weekly loop
All featuresSee where your form is heading
Connect your watch: your activities come in, the curves draw themselves, and the next three weeks of your plan show up as dashed lines.
Free forever. No credit card.